On Friday February 3rd, the Bureau of Labor Statistics published an employment report that roiled markets. Investors hardly knew which way to turn. In the end, both stock and bond markets ended the day down, the S&P dropping 1.0%(1) and 10-year Treasury bond yields rising by 13 basis points(2).
An observer might have been forgiven for being puzzled by this reaction. The employment report showed good economic news – more people were employed in January than expected, by quite a wide margin. 517,000(3) new jobs were created vs. 185,000(4) expected. Good employment numbers are usually positive for financial assets, especially equities. Higher employment is supposed to lead to higher consumption and GDP growth which leads to higher revenue and profits for companies. Ordinarily, equities follow this line of thinking and rise on evidence of stronger economic activity. However, sometimes economic circumstances are such that this logic is turned on its head, and “good economic news” becomes “bad news” for equities. This is what happened on Friday.
It is difficult to know exactly when financial markets are going to flip from one line of thinking (“good news” is “good news”) to the other (“good news” is “bad news”). Or how long they are going to stay flipped. But one of the most important determining factors is inflation.
Strong economic reports are more likely to be interpreted as negative for equities when inflation is either already a problem or threatens to be one soon. Take the current situation. With the CPI running at 6.4%(5) year over year, inflation today is well above the Fed’s target rate of 2% and is definitely considered a problem. Current conditions therefore suggest an inversion of the usual logic. How does this inverted logic work? Well, if we take the employment report as an example, an extra 517,000 jobs were added in January (compared with 412,166(6) added per month last year) suggesting a very strong labor market. This strength, the argument goes, will add to upward pressure on wages forcing companies to pass higher labor costs onto consumers in the form of higher prices. Seeing higher inflation, the Federal Reserve will have no choice but to keep interest rates higher for longer making a recession more likely, which is bad for company earnings. And voila! – the market has turned “good news” into “bad news”.
So, forecasting how the stock market is going to interpret and react to economic news is not as easy as it looks. And this is not the only difficulty with economic signals. Sometimes the issue lies with the data itself. Just how strong was Friday’s employment growth really?
Well, let’s look at the data more carefully. First of all, it is important to realize that the January employment report is chock full of seasonal adjustments. (Seasonal adjustment is a statistical technique that attempts to measure and remove the influences of predictable seasonal patterns from data.) So while the headline number showed an extra half a million jobs being created, the actual, non-seasonally adjusted number showed a decline of 2.5 million(7). Yes, jobs were actually lost in January! Seasonal adjustments can distort data and this headline number certainly looks like it could be an outlier (see Fig.1). Additionally, employment numbers are really just estimates that are later benchmarked against data derived from state unemployment insurance tax records. Benchmarking can cause numbers to be revised meaningfully at a later date. Could this number be revised down in the future? Possibly.
Fig. 1 Change in Non-farm Payroll, seasonally adjusted, month over month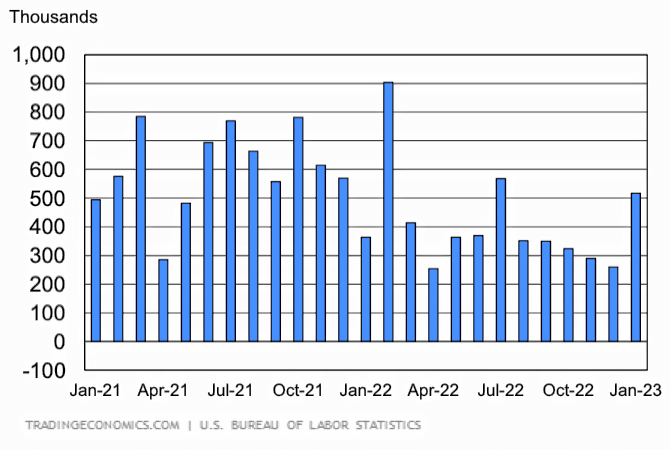
Secondly, giving full faith and credit to the adjusted number, some of the biggest increases in hiring were in service industries pummeled by Covid and now playing catch-up e.g. leisure and hospitality. This sector added the most jobs in January at 128,000(8) and still needs to add 515,000(9) more to get back up to pre-pandemic levels. Once these sectors have caught up, the theory goes, they will stop hiring.
So, after considering the effects of seasonal adjustments, potential revisions and unique industry circumstances, it is not so clear that Friday’s jobs report actually showed the robust employment growth that the market reacted to. With economic data, just as with many other things in life, sometimes first impressions can mislead.
Friday’s job report illustrates another problem with trying to read the tea leaves produced by economic numbers – conflicting indicators that undermine Wall St’s tidy logic.
Friday’s report showed that wage growth slowed. Average hourly earnings, the BLS indicator for wages, rose just 4.4%(10) in January year over year, the lowest reading since August 2021. And this was not just a rogue datapoint. Wage growth has been decelerating since March 2022(11) (see Fig. 2).
Fig. 2 Average Hourly Earnings Growth, year over year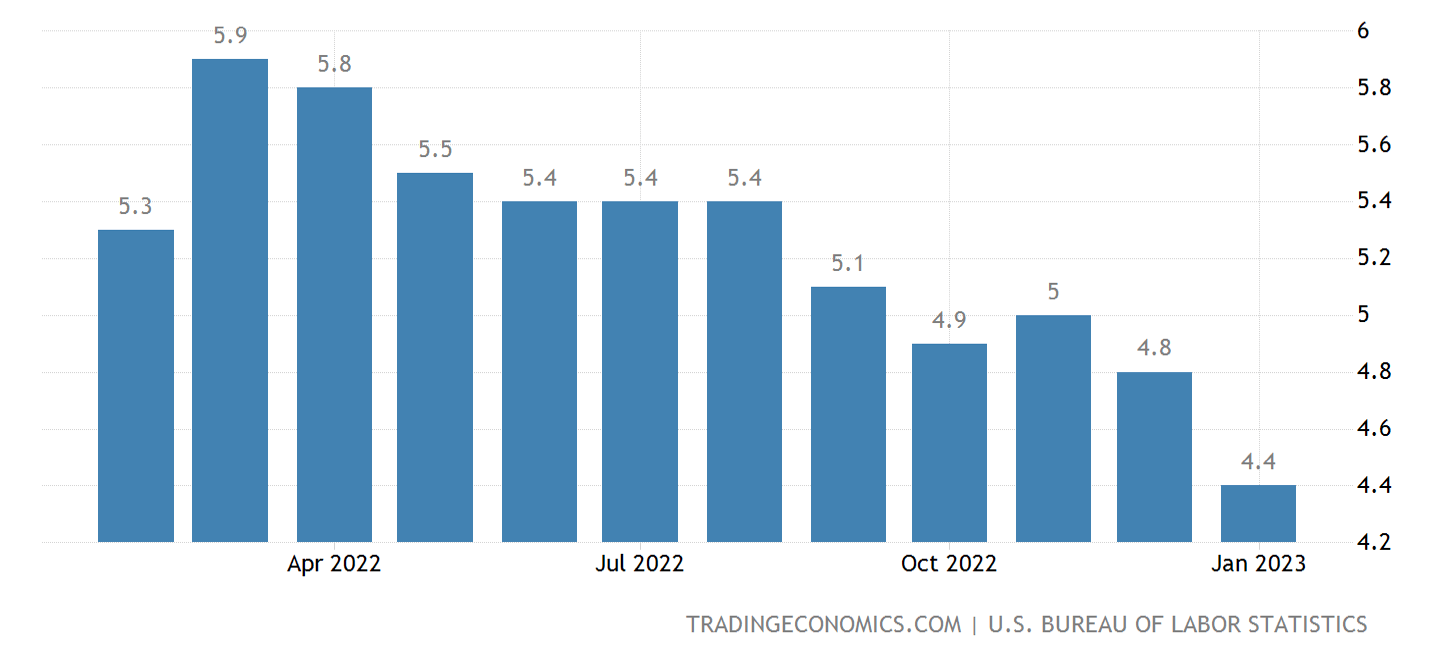
But wait…the unemployment rate is at 3.4%(12) – the lowest level since 1969 and the demand for labor is, apparently, soaring. Why isn’t wage growth accelerating?
Well, the first point to note is that moderate wage growth can coexist with a tight labor market. In the period between Q1
2015 and Q1 2020, for example, unemployment stayed below 5%(13) and wage growth stayed below 4%(14). This economic evidence damages the “good news is bad news” argument right at its very heart. If strong employment doesn’t lead to higher wages, then it can’t lead to higher interest rates and recession.
And secondly, well, maybe the labor market has more slack than appears on the surface.
Slack in the labor market works just like slack in a rope. More slack in the labor market, means demand for workers will be met with more people hired. Less slack means more demand for workers will be met with higher wages because there are no more extra people to hire.
Unsurprisingly, given other labor market data, the traditional measure of slack in the labor market, the number of job openings divided by the number of people officially unemployed, is currently indicating no slack at all. The December JOLTS report showed a level of 1.9(15) – almost two jobs for every person looking – up from a historic norm of 0.7(16).
The problem with this measure of slack, however, is that it does not count folks unless they are officially unemployed. A look at the labor force participation rate helps explain why this matters. The labor force participation rate is the number of people employed and officially unemployed (165 million(17)) expressed as a percentage of the civilian population (265 million(18)). This leaves a whopping 100 million people not counted officially as potential workers because they are not officially unemployed. Recently, more of these potential workers have been entering the workforce as the participation rate has been rising steadily after a big covid-induced drop (see Fig. 3). If the labor participation rate were to just go back up to where it was right before the pandemic, that would bring 2.5 million extra folk into the workforce. These folk represent “hidden” slack that the official measure is missing.
Fig. 3 Labor Force Participation Rate, %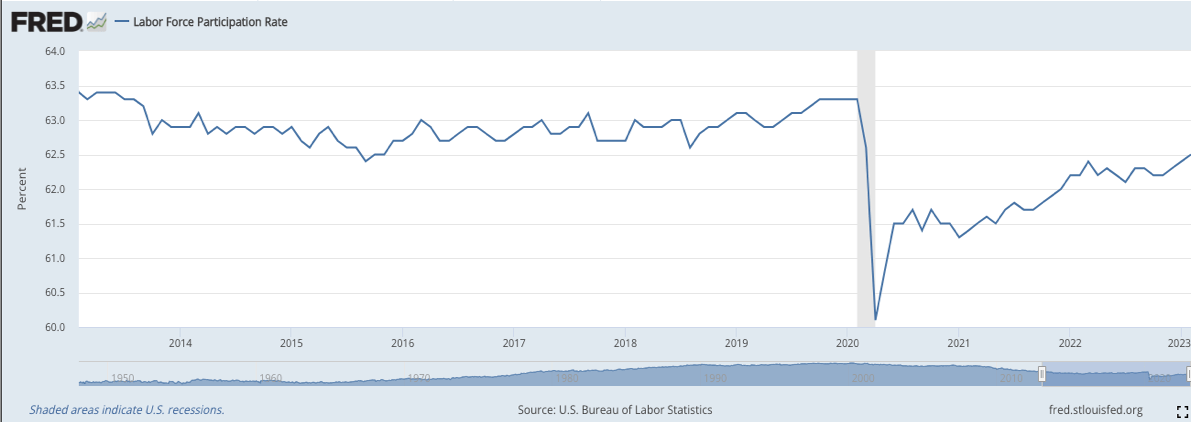
Clearly, analyzing economic data for guidance on the outlook for stocks and bonds is not a straightforward business. Economic strength can be either good or bad for equity prices depending on how nervous investors are that day about the interplay between inflation and recession. Seasonal factors and other behind the scenes tinkering means investors can’t always rely on the headline numbers. Individual indicators of difficult to measure concepts like slack in the labor market may have intrinsic drawbacks and give an incomplete picture. Economic forces do not always play out in the same way every time or follow the script Wall St is used to reading. Powerful secular trends like a change in the labor force participation rate can be moving behind the scenes, possibly influencing the relationship between unemployment, say, and pressures on wage growth.
In the end, interpretation of economic data should be approached with caution and a large shovel (for digging deeper) by the market and investors alike.
Sources
1, 2, 5, 6 Bloomberg
3, 4, 12 Reuters
10, 11, 14 Trading Economics
15, 16 HBR
7, 8, 17, 18 BLS
9 St Louis Fed
The information contained in this communication is provided for general purposes only, and was prepared in reliance on independent, third-party sources that Fairview Capital Investment Management, LLC (“Fairview Capital”), an SEC-registered investment adviser, believes are reliable. Nevertheless, Fairview Capital does not guarantee its accuracy or timeliness of any information provided herein. The information reflects subjective judgments, assumptions and Fairview Capital’s opinion on the date made and may change without notice; Fairview Capital is not obligated to update this information. Nothing in this communication should be construed as investment or tax advice, a solicitation, offer, or recommendation, to buy or sell any security. Investment management services are offered only pursuant to a written investment management agreement, which investors are urged to carefully read and consider in determining whether such agreement is suitable for their individual needs and circumstances. The information in this communication should not be construed as an endorsement, recommendation or sponsorship of any company or security. If this post mentions a specific investment or security, we or our affiliates may have a position in that security (either long or short), and we may profit from a price change in that security.
Investment management and advisory services–which are not FDIC insured–are provided by Fairview Capital. Any links provided to other sites are offered as a matter of convenience and are not intended to imply that Fairview Capital or its affiliates endorses, sponsors, promotes and/or is affiliated with the owners of or participants in those sites, or endorses any information contained on those sites, unless expressly stated otherwise. All investing involves risk, including the possible loss of money you invest, and past performance does not guarantee future performance. Please see Fairview Capital’s Form ADV Part 2A and Form CRS for important details.